按关键词阅读:
1 说明:
=====
1.1 MPLD3=mpl+d3=matplotlib+D3js 。
1.2 是基于当前python下面最流行的图形图像库matplotlib和最知名的javascript库D3js上开发得到的 。
1.3 用于创建web交互式数据可视化 。
1.4 mpld3——Bringing Matplotlib to the Browser 。
 文章插图
文章插图
2 准备:
=====
2.1 官网:
#很慢很卡 , 我没上去2.2 安装:
pip install mpld3#其实不用安装 , 新版的matplotlib自带的2.3 环境:
华为笔记本电脑、深度deepin-linux操作系统、谷歌浏览器、python3.8和微软vscode编辑器 。
3 折线图:
========
3.1 代码:
#折线图#从模块导入就知道 , mpld3是matplotlib自带的import matplotlib.pyplot as plt, mpld3#import mpld3#也可以这样导出#这是图片大小设置 , 建议这样设置大小 , 默认太大不好看fig=plt.figure(figsize=(3,2))#fig=plt.figure(num=1,figsize=(3,2))datax=[3,1,4,1,5]#plt.plot([3,1,4,1,5], 'ks-', mec='w', mew=5, ms=20)#"r-.d"代表red-.div==红色-.-.-.◇菱形#"c-d"plt.plot(datax, 'r-.d', mec='w', mew=5, ms=20)mpld3.show()3.2 操作和效果图:
 文章插图
文章插图
4 图和图例的交互式:
===============
4.1 代码:
import matplotlib.pyplot as plt,mpld3import numpy as npimport pandas as pd#import mpld3#这种导出注释掉 , 放在matplotlib的第一行那样导出from mpld3 import plugins#数据np.random.seed(9615)N = 100#支持中文df = pd.DataFrame((.1 * (np.random.random((N, 5)) - .5)).cumsum(0),columns=['a组', 'b组', 'c组', 'd组', 'e组'],)#折线图和交互式组合# plot line + confidence intervalfig, ax = plt.subplots(figsize=(3,2))#等价于下面2行#fig = plt.figure(figsize=(3,2))#ax = fig.add_subplot(1,1,1)#以上这样设置图片大小成功ax.grid(True, alpha=0.3)for key, val in df.iteritems():l, = ax.plot(val.index, val.values, label=key)ax.fill_between(val.index,val.values * .5, val.values * 1.5,color=l.get_color(), alpha=.4)# define interactive legendhandles, labels = ax.get_legend_handles_labels() # return lines and labelsinteractive_legend = plugins.InteractiveLegendPlugin(zip(handles,ax.collections),labels,alpha_unsel=0.5,alpha_over=1.5,start_visible=True)#图片和图例的交互式插件的联系设置plugins.connect(fig, interactive_legend)ax.set_xlabel('x')ax.set_ylabel('y')#图的标题名和大小ax.set_title('Interactive legend', size=20)mpld3.show()4.2 图:
 文章插图
文章插图
4.3 小插曲:
这里中文是支持的 , 这个和我曾经的matplotlib中文支持有点不一样 , 可以参考我的另外一篇文章 , 里面有提到 。
《NetworkX:是一个简单、多样化、能快速生成网络图形的Python库》 , 这篇文章的第6点:中文显示 , 简单且一劳永逸 。
5 散点图:
=======
5.1 代码:
#Scatter图import matplotlib.pyplot as plt,mpld3import numpy as np#方法一 , facecolor背景颜色fig, ax = plt.subplots(subplot_kw=dict(facecolor='#EEEEEE'),figsize=(3, 2))#fig, ax = plt.subplots(subplot_kw=dict(facecolor='lightpink'),figsize=(3, 2))#fig, ax = plt.subplots()#采用默认#方法二#fig = plt.figure(figsize=(3,2))#ax = fig.add_subplot(1,1,1)#方法三#fig, ax = plt.subplots(1,1, figsize=(3, 2))N = 100scatter = ax.scatter(np.random.normal(size=N),np.random.normal(size=N),c=np.random.random(size=N),s=1000 * np.random.random(size=N),alpha=0.3,cmap=plt.cm.jet)#网格设置#ax.grid(color='white', linestyle='solid')#图标标题名ax.set_title("Scatter Plot (with tooltips!)", size=20)labels = ['point {0}'.format(i + 1) for i in range(N)]#显示鼠标小提示tooltip = mpld3.plugins.PointLabelTooltip(scatter, labels=labels)mpld3.plugins.connect(fig, tooltip)mpld3.show()5.2 图:
 文章插图
文章插图
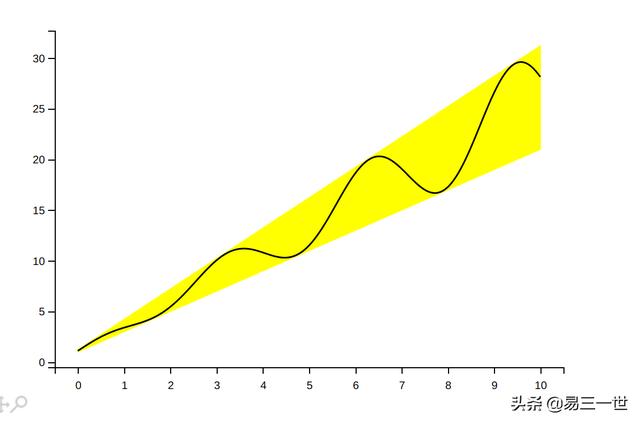
6 面积曲线图:
==========
6.1 代码:
import matplotlib.pyplot as plt, mpld3import numpy as npx = np.linspace(0, 10, 200)data_obj = {'x': x,'y1': 2 * x + 1,'y2': 3 * x + 1.2,'mean': 0.5 * x * np.cos(2*x) + 2.5 * x + 1.1}#fig, ax = plt.subplots()#默认大小fig, ax = plt.subplots(1,1,figsize=(3,2))#填充两条线之间的颜色ax.fill_between('x', 'y1', 'y2', color='yellow', data=http://kandian.youth.cn/index/data_obj)ax.plot('x', 'mean', color='black', data=http://kandian.youth.cn/index/data_obj)mpld3.show()6.2 图:
 文章插图
文章插图
7 拖拽drag:
========
7.1 结合d3.js的JavaScript的代码:
import numpy as npimport matplotlib.pyplot as pltimport matplotlib as mplimport mpld3from mpld3 import plugins, utilsclass DragPlugin(plugins.PluginBase):JAVASCRIPT = """mpld3.register_plugin("drag", DragPlugin);DragPlugin.prototype = Object.create(mpld3.Plugin.prototype);DragPlugin.prototype.constructor = DragPlugin;DragPlugin.prototype.requiredProps = ["id"];DragPlugin.prototype.defaultProps = {}function DragPlugin(fig, props){mpld3.Plugin.call(this, fig, props);mpld3.insert_css("#" + fig.figid + " path.dragging",{"fill-opacity": "1.0 !important","stroke-opacity": "1.0 !important"});};DragPlugin.prototype.draw = function(){var obj = mpld3.get_element(this.props.id);var drag = d3.drag().subject(function(d) { return {x:obj.ax.x(d[0]),y:obj.ax.y(d[1])}; }).on("start", dragstarted).on("drag", dragged).on("end", dragended);obj.elements().data(obj.offsets).style("cursor", "default").call(drag);function dragstarted(d) {d3.event.sourceEvent.stopPropagation();d3.select(this).classed("dragging", true);}function dragged(d, i) {d[0] = obj.ax.x.invert(d3.event.x);d[1] = obj.ax.y.invert(d3.event.y);d3.select(this).attr("transform", "translate(" + [d3.event.x,d3.event.y] + ")");}function dragended(d) {d3.select(this).classed("dragging", false);}}"""def __init__(self, points):if isinstance(points, mpl.lines.Line2D):suffix = "pts"else:suffix = Noneself.dict_ = {"type": "drag","id": utils.get_id(points, suffix)}fig, ax = plt.subplots(1,1,figsize=(3,2))np.random.seed(0)points = ax.plot(np.random.normal(size=20),np.random.normal(size=20), 'or', alpha=0.5,markersize=50, markeredgewidth=1)ax.set_title("Click and Drag", fontsize=18)plugins.connect(fig, DragPlugin(points[0]))mpld3.show()![]()
稿源:(未知)
【傻大方】网址:http://www.shadafang.com/c/111T314U2020.html
标题:Mpld3库:一个matplotlib被忽视功能,python数据可视化web库